Kappa
“Great things are not done by impulse, but by a series of small things brought together.”
Hack The Box
Analysis with Wireshark
Wireshark is a free and open-source network traffic analyzer much like tcpdump but with a graphical interface. Wireshark is multi-platform and capable of capturing live data off many different interface types (to include WiFi, USB, and Bluetooth) and saving the traffic to several different formats. Wireshark allows the user to dive much deeper into the inspection of network packets than other tools. What makes Wireshark truly powerful is the analysis capability it provides, giving a detailed insight into the traffic.
Depending on the host we are using, we may not always have a GUI to utilize traditional Wireshark. Lucky for us, several variants allow us to use it from the command line.
Features and Capabilities:
- Deep packet inspection for hundreds of different protocols
- Graphical and TTY interfaces
- Capable of running on most Operating systems
- Ethernet, IEEE 802.11, PPP/HDLC, ATM, Bluetooth, USB, Token Ring, Frame Relay, FDDI, among others
- Decryption capabilities for IPsec, ISAKMP, Kerberos, SNMPv3, SSL/TLS, WEP, and WPA/WPA2
- Many many more...
Requirements for Use
Windows:
- The Universal C Runtime. This is included with Windows 10 and Windows Server 2019 and is installed automatically on earlier versions if Microsoft Windows Update is enabled. Otherwise, KB2999226 or KB3118401 must be installed.
- Any modern 64-bit AMD64/x86-64 or 32-bit x86 processor.
- 500 MB available RAM. Larger capture files require more RAM.
- 500 MB available disk space. Capture files require additional disk space.
- Any modern display. 1280 × 1024 or higher resolution is recommended. Wireshark will make use of HiDPI or Retina resolutions if available. Power users will find multiple monitors useful.
- A supported network card for capturing.
- Ethernet. Any card supported by Windows should work.
- 802.11. See the Wireshark wiki page. Capturing raw 802.11 information may be difficult without special equipment.
- To install, download the executable from wireshark.org, validate the hash, and install.
Linux:
- Wireshark runs on most UNIX and UNIX-like platforms, including Linux and most BSD variants. The system requirements should be comparable to the specifications listed above for Windows.
- Binary packages are available for most Unix and Linux distributions.
To validate if the package exists on a host, use the following command:
Locating Wireshark
kalijester68@htb[/htb]$ which wireshark
If the package does not exist, (It can often be found in /usr/sbin/wireshark) you can install it with:
Installing Wireshark On Linux
kalijester68@htb[/htb]$ sudo apt install wireshark
TShark VS. Wireshark (Terminal vs. GUI)
Both options have their merits. TShark is a purpose-built terminal tool based on Wireshark. TShark shares many of the same features that are included in Wireshark and even shares syntax and options. TShark is perfect for use on machines with little or no desktop environment and can easily pass the capture information it receives to another tool via the command line. Wireshark is the feature-rich GUI option for traffic capture and analysis. If you wish to have the full-featured experience and work from a machine with a desktop environment, the Wireshark GUI is the way to go.
Basic TShark Switches
- D - Will display any interfaces available to capture from and then exit out.
- L - Will list the Link-layer mediums you can capture from and then exit out. (ethernet as an example)
- i - choose an interface to capture from. (-i eth0)
- f - packet filter in libpcap syntax. Used during capture.
- c - Grab a specific number of packets, then quit the program. Defines a stop condition.
- a - Defines an autostop condition. Can be after a duration, specific file size, or after a certain number of packets.
- r - (pcap-file) Read from a file.
- W - (pcap-file) Write into a file using the pcapng format.
- P - Will print the packet summary while writing into a file (-W)
- x - will add Hex and ASCII output into the capture.
- h - See the help menu
To see the full list of switches you can utilize:
TShark Help
kalijester68@htb[/htb]$ tshark -h
TShark Basic Usage
TShark can use filters for protocols, common items like hosts and ports, and even the ability to dig deeper into the packets and dissect individual fields from the packet.
Locating TShark
          kalijester68@htb[/htb]$ which tshark
          kalijester68@htb[/htb]$ tshark -D
          kalijester68@htb[/htb]$ tshark -i 1 -w /tmp/test.pcap
Capturing on 'Wi-Fi: en0' 484
With the basic string in the command line above, we utilize TShark to capture on en0, specified with the -i flag and the -w option to save the capture to a specified output file. Utilizing TShark is very similar to TCPDump in the filters and switches we can use. Both tools utilize BPF syntax. To read the capture, tshark can be passed the -r switch just like in TCPDump, or we can pass the -P switch to have tshark print the packet summaries while writing out to a file. Below is an example of reading from the PCAP file we previously captured.
Selecting an Interface & Writing to a File
kalijester68@htb[/htb]$ sudo tshark -i eth0 -w /tmp/test.pcap
Applying Filters
          kalijester68@htb[/htb]$ sudo tshark -i eth0 -f "host 172.16.146.2"

          Capturing on 'eth0'
            1  0.000000000 172.16.146.2 → 172.16.146.1 DNS 70 Standard query 0x0804 A github.com
            2  0.258861645 172.16.146.1 → 172.16.146.2 DNS 86 Standard query response 0x0804 A github.com A 140.82.113.4
            3  0.259866711 172.16.146.2 → 140.82.113.4 TCP 74 48256 → 443 [SYN] Seq=0 Win=64240 Len=0 MSS=1460 SACK_PERM=1 TSval=1321417850 TSecr=0 WS=128
            4  0.299681376 140.82.113.4 → 172.16.146.2 TCP 74 443 → 48256 [SYN, ACK] Seq=0 Ack=1 Win=65535 Len=0 MSS=1436 SACK_PERM=1 TSval=3885991869 TSecr=1321417850 WS=1024
            5  0.299771728 172.16.146.2 → 140.82.113.4 TCP 66 48256 → 443 [ACK] Seq=1 Ack=1 Win=64256 Len=0 TSval=1321417889 TSecr=3885991869
            6  0.306888828 172.16.146.2 → 140.82.113.4 TLSv1 579 Client Hello
            7  0.347570701 140.82.113.4 → 172.16.146.2 TLSv1.3 2785 Server Hello, Change Cipher Spec, Application Data, Application Data, Application Data, Application Data
            8  0.347653593 172.16.146.2 → 140.82.113.4 TCP 66 48256 → 443 [ACK] Seq=514 Ack=2720 Win=63488 Len=0 TSval=1321417937 TSecr=3885991916
            9  0.358887130 172.16.146.2 → 140.82.113.4 TLSv1.3 130 Change Cipher Spec, Application Data
            10 0.359781588 172.16.146.2 → 140.82.113.4 TLSv1.3 236 Application Data
            11 0.360037927 172.16.146.2 → 140.82.113.4 TLSv1.3 758 Application Data
            12 0.360482668 172.16.146.2 → 140.82.113.4 TLSv1.3 258 Application Data
            13 0.397331368 140.82.113.4 → 172.16.146.2 TLSv1.3 145 Application Data
-f allows us to apply filters to the capture. In the example, we utilized host, but you can use almost any filter Wireshark recognizes. We have touched on TShark a bit now. Let's take a look at a nifty tool called Termshark.
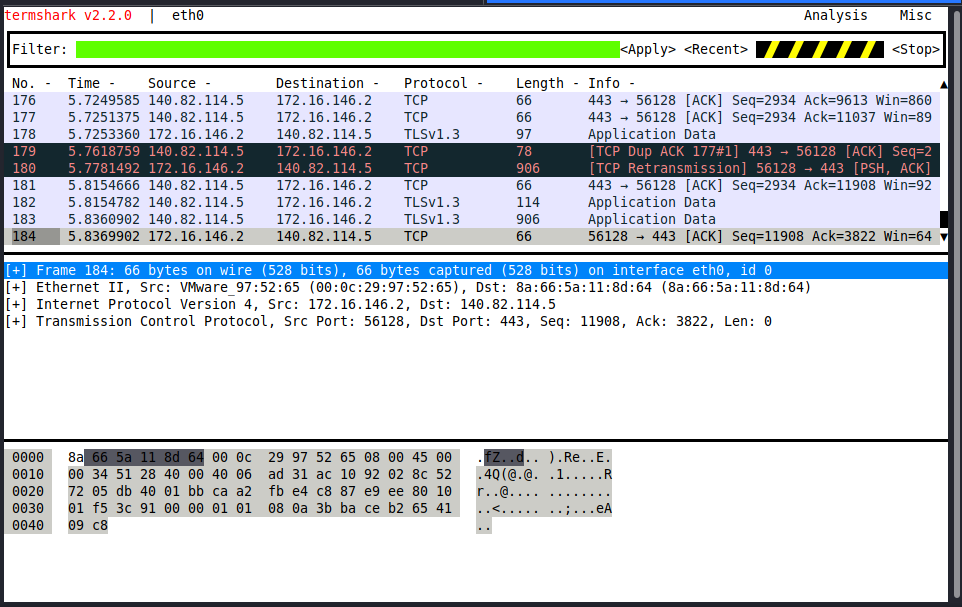
Termshark
Termshark is a Text-based User Interface (TUI) application that provides the user with a Wireshark-like interface right in your terminal window.
Termshark can be found at Termshark. It can be built from the source by cloning the repo, or pull down one of the current stable releases from https://github.com/gcla/termshark/releases , extract the file, and hit the ground running.
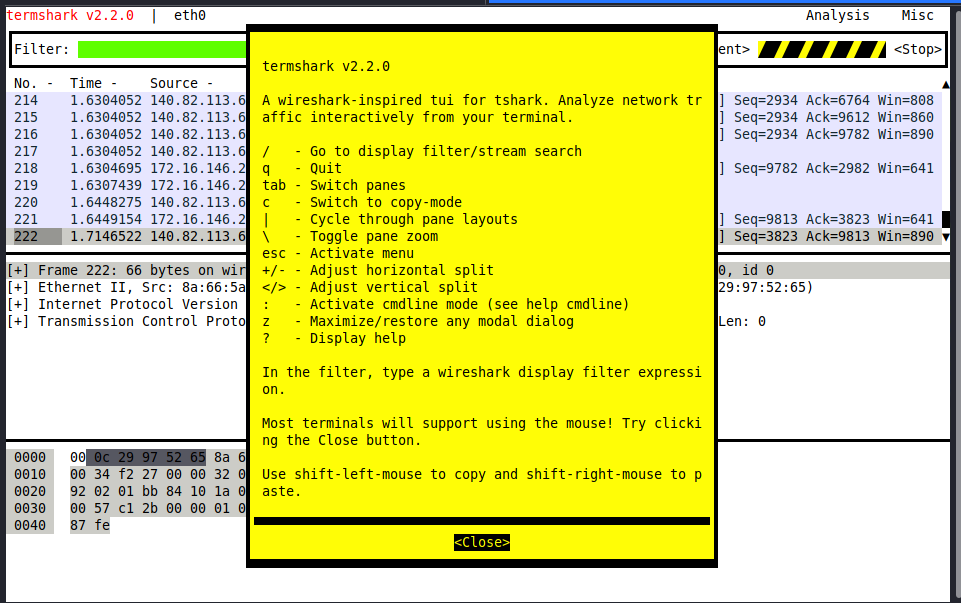
For help navigating this TUI, see the image below.
To start Termshark, issue the same strings, much like TShark or tcpdump. We can specify an interface to capture on, filters, and other settings from the terminal. The Termshark window will not open until it senses traffic in its capture filter. So give it a second if nothing happens.
Wireshark GUI Walkthrough
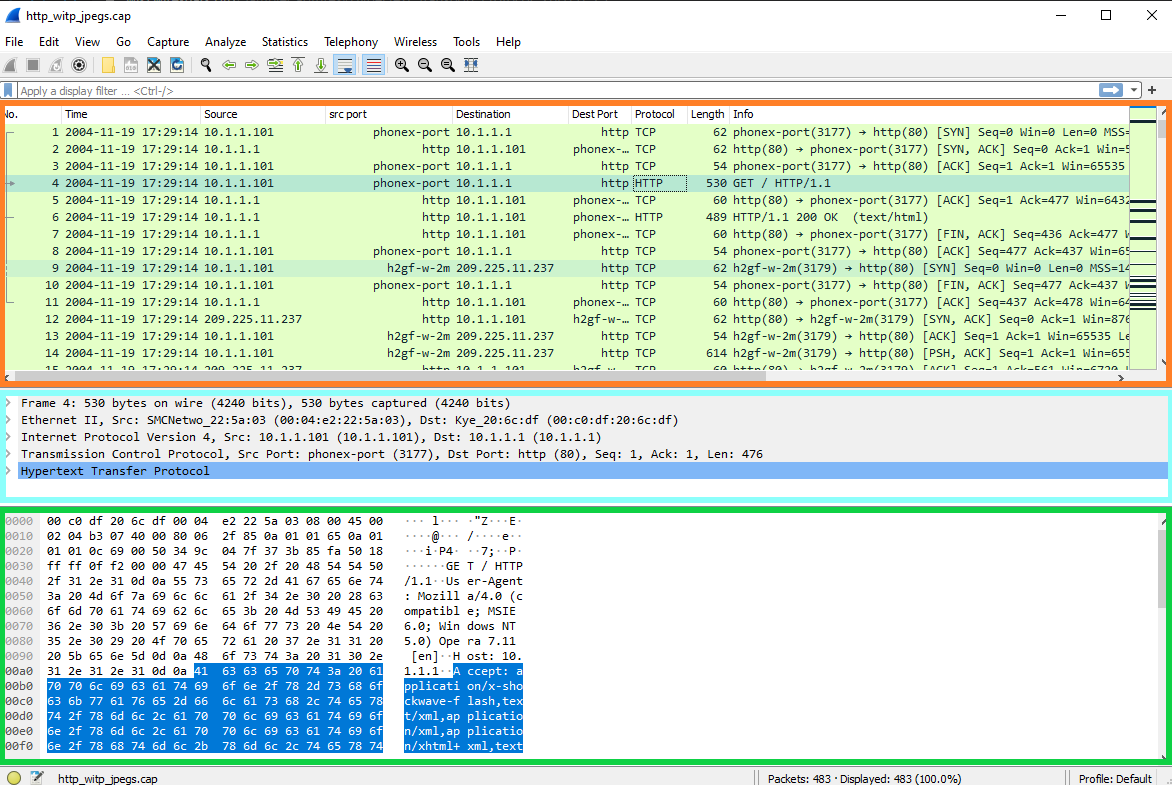
Now that we have spent time learning the art of packet capture from the command line let's spend some time in Wireshark. We will take a few minutes to examine what we are looking at in the output below. Let's dissect this view of the Wireshark GUI.
Packet List: Orange
In this window, we see a summary line of each packet that includes the fields listed below by default. We can add or remove columns to change what information is presented.
- Number - Order the packet arrived in Wireshark
- Time - Unix time format
- Source - Source IP
- Destination - Destination IP
- Protocol - The protocol used (TCP, UDP, DNS, ETC.)
- Information - Information about the packet. This field can vary based on the type of protocol used within. It will show, for example, what type of query It is for a DNS packet.
Packet Details: Blue
The Packet Details window allows us to drill down into the packet to inspect the protocols with greater detail. It will break it down into chunks that we would expect following the typical OSI Model reference. The packet is dissected into different encapsulation layers for inspection.
Keep in mind, Wireshark will show this encapsulation in reverse order with lower layer encapsulation at the top of the window and higher levels at the bottom.
Packet Bytes: Green
The Packet Bytes window allows us to look at the packet contents in ASCII or hex output. As we select a field from the windows above, it will be highlighted in the Packet Bytes window and show us where that bit or byte falls within the overall packet.
This is a great way to validate that what we see in the Details pane is accurate and the interpretation Wireshark made matches the packet output.
Each line in the output contains the data offset, sixteen hexadecimal bytes, and sixteen ASCII bytes. Non-printable bytes are replaced with a period in the ASCII format.
Other Notable Features
When looking at the Wireshark interface, we will notice a few different option areas and radial buttons. These areas are control points in which we can modify the interface and our view of the packets in the current capture. See Figure below
Performing our first capture in Wireshark
Starting a capture with Wireshark is a simple endeavor. The gif below will show the steps.
Keep in mind, any time we change the capture options, Wireshark will restart the trace. Much like TCPDump, Wireshark has capture and display filter options that can be used.
The Basics
The Toolbar
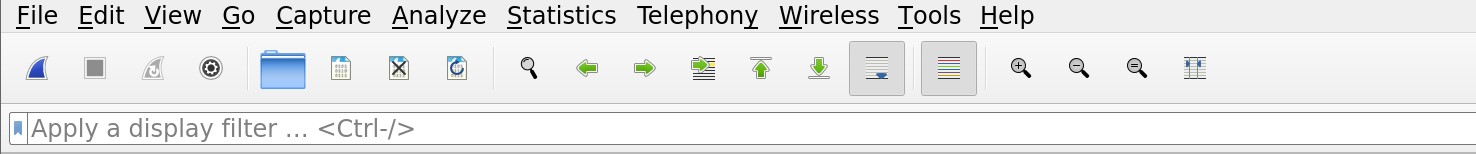
Wireshark's Toolbar is a central point to manage the many features Wireshark includes. From here, we can start and stop captures, change interfaces, open and save .pcap files and apply different filters or analysis add-ins.
How to Save a Capture
Let's say we need to capture what we have in our window currently for troubleshooting later. Saving a capture is super simple:
- Select File ⇢ save OR
- From the toolbar, select the file option and choose where to save the file and in what format.
Be aware that Wireshark can save captures into multiple formats. Choose the one needed for the scenario, but we will use the .pcap format for now.
Pre-capture and Post-capture Processing and Filtering
While capturing traffic with Wireshark, we have several options regarding how and when we filter out traffic. This is accomplished utilizing Capture and Display filters. The Former initiated before the capture starts and the latter during or after capture is complete. While Wireshark has a bunch of useful baked-in functionality, it is worth mentioning that it has a bit of trouble handling large captures. The more packets captured, the longer it will take Wireshark to run the display or analysis filter against it. It can take from just a couple of seconds to a few minutes if it completes at all. If we are working with a large pcap file, it may be best to break it up into smaller chunks first.
Capture Filters
Capture Filters - are entered before the capture is started. These use BPF syntax like host 214.15.2.30 much in the same fashion as TCPDump. We have fewer filter options this way, and a capture filter will drop all other traffic not explicitly meeting the criteria set. This is a great way to trim down the data you write to disk when troubleshooting a connection, such as capturing the conversations between two hosts.
Here is a table of common and helpful capture filters with a description of each:
- host x.x.x.x - Capture only traffic pertaining to a certain host
- net x.x.x.x/24 - Capture traffic to or from a specific network (using slash notation to specify the mask)
- src/dst net x.x.x.x/24 - Using src or dst net will only capture traffic sourcing from the specified network or destined to the target network
- port # - will filter out all traffic except the port you specify
- not port # - will capture everything except the port specified
- port # and # - AND will concatenate your specified ports
- portrange x-x - portrange will grab traffic from all ports within the range only
- ip / ether / tcp - These filters will only grab traffic from specified protocol headers.
- broadcast / multicast / unicast - Grabs a specific type of traffic. one to one, one to many, or one to all.
Applying a Capture Filter
Before we apply a capture filter, let us take a look at the built-in filters. To do so: Click on the capture radial at the top of the Wireshark window → then select capture filters from the drop-down.
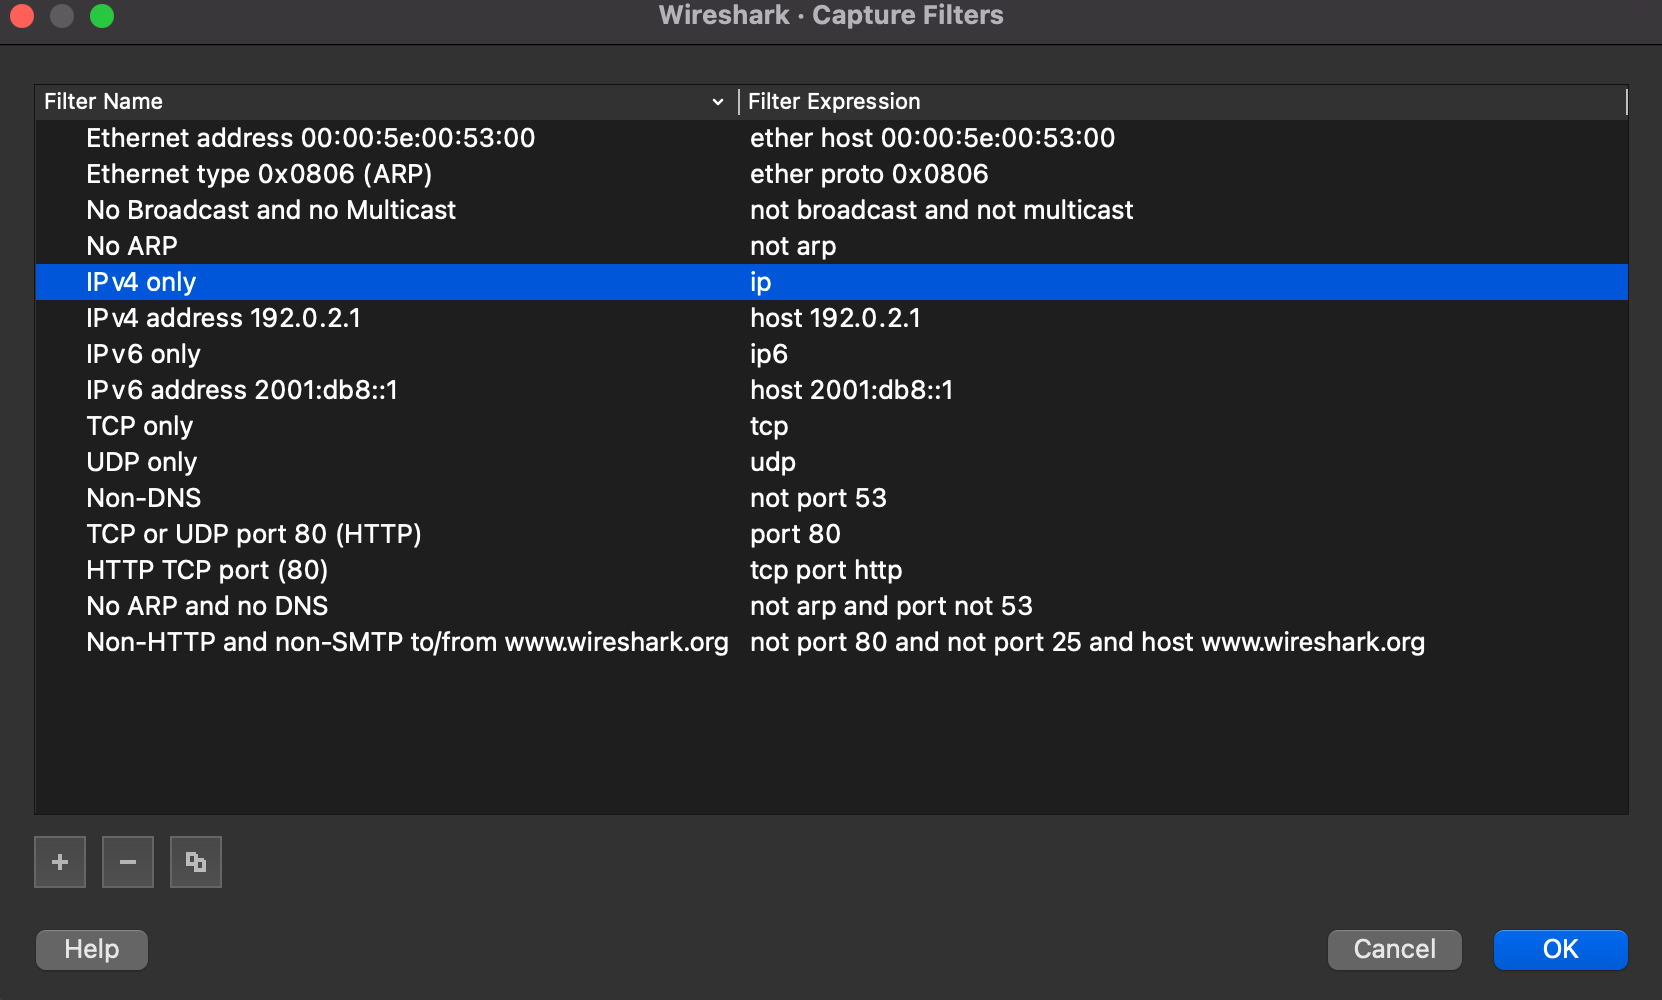
From here, we can modify the existing filters or add our own.
To apply the filter to a capture, we will: Click on the capture radial at the top of the Wireshark window → then select Options from the drop-down → in the new window select the drop-down for Capture filter for selected interfaces or type in the filter we wish to use. below the red arrow in the picture below
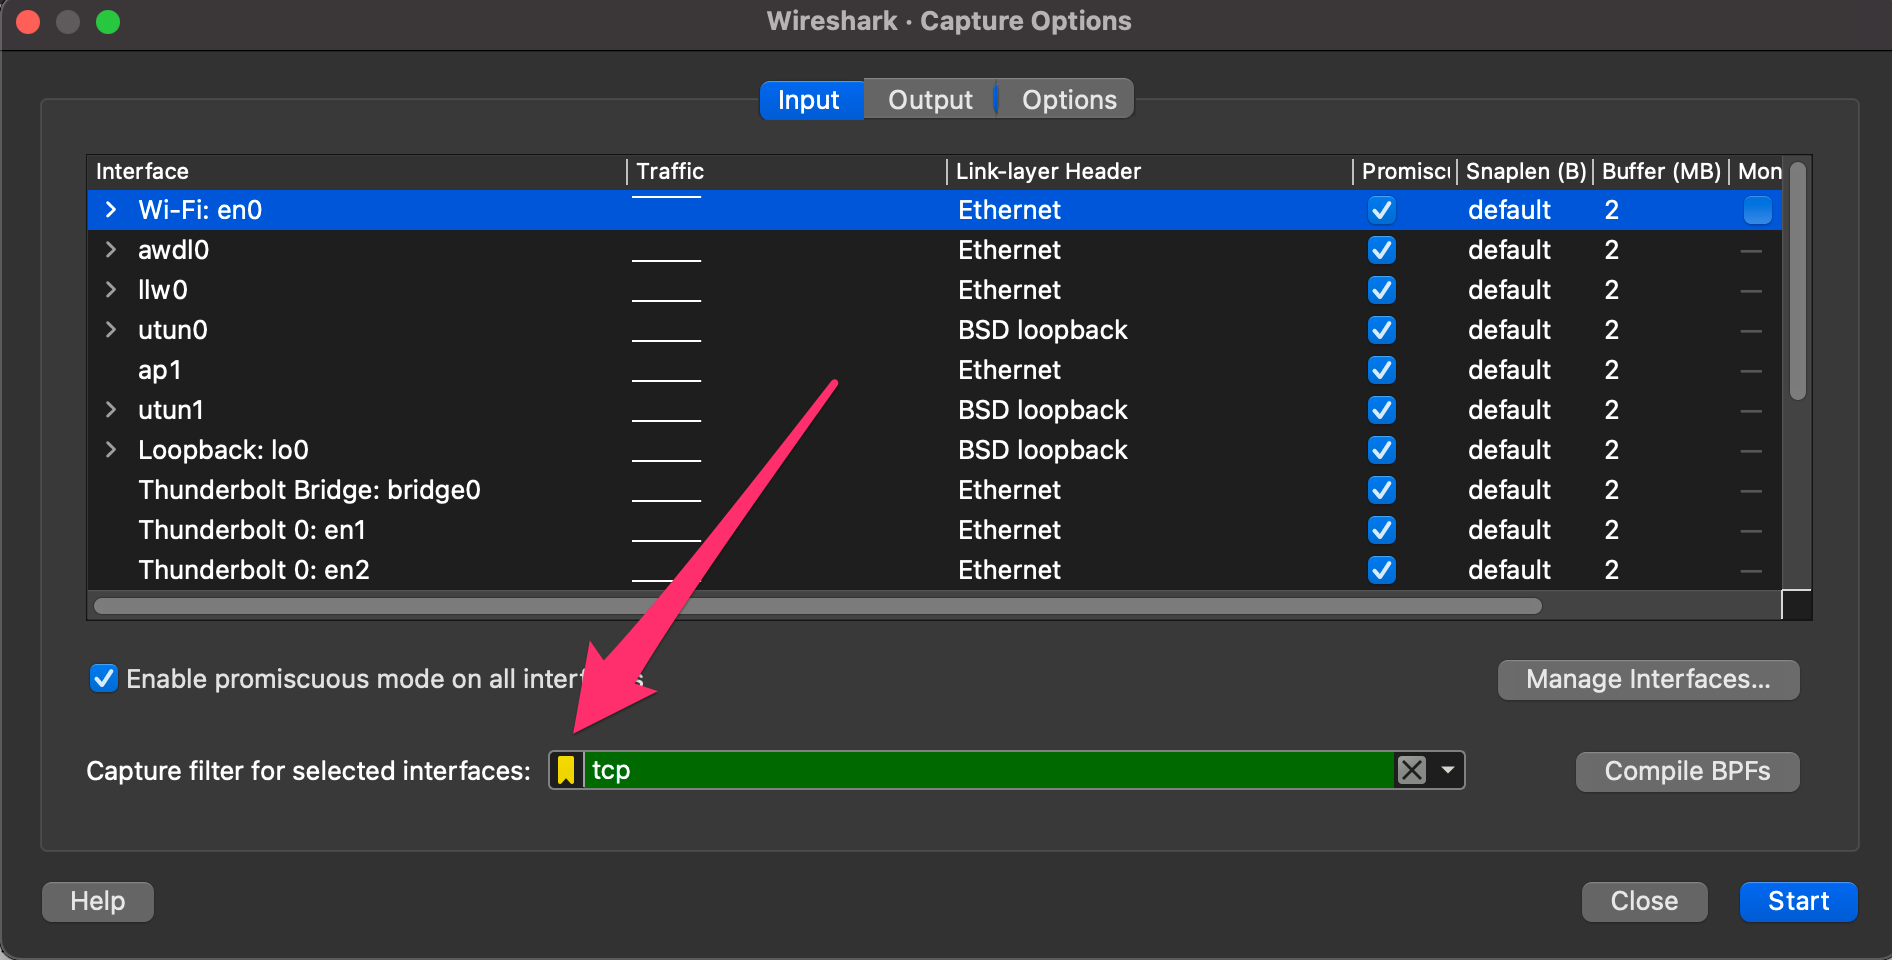
Display Filters
Display Filters- are used while the capture is running and after the capture has stopped. Display filters are proprietary to Wireshark, which offers many different options for almost any protocol.
Here is a table of common and helpful display filters with a description of each:
- ip.addr == x.x.x.x - Capture only traffic pertaining to a certain host. This is an OR statement.
- ip.addr == x.x.x.x/24 - Capture traffic pertaining to a specific network. This is an OR statement.
- ip.src/dst == x.x.x.x - Capture traffic to or from a specific host
- dns / tcp / ftp / arp / ip - filter traffic by a specific protocol. There are many more options.
- tcp.port == x - filter by a specific tcp port.
- tcp.port / udp.port != x - will capture everything except the port specified
- and / or / not - AND will concatenate, OR will find either of two options, NOT will exclude your input option.
Keep in mind, while utilizing Display filters traffic is processed to show only what is requested but the rest of the capture file will not be overwritten. Applying Display filters and analysis options will cause Wireshark to reprocess the pcap data in order to apply.
Applying a Display Filter
Applying a display filter is even easier than a capture filter. From the main Wireshark capture window, all we need to do is: select the bookmark in the Toolbar → , then select an option from the drop-down. Alternatively, place the cursor in the text radial → and type in the filter we wish to use. If the field turns green, the filter is correct. Just like in the image below.
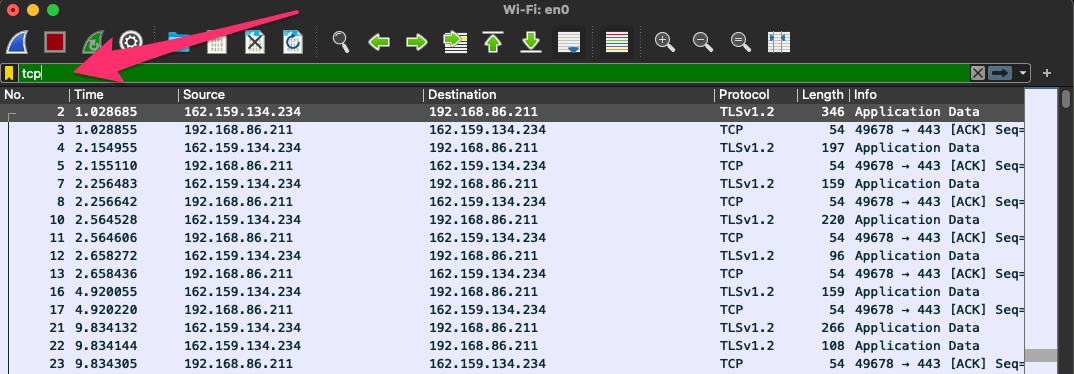
When using capture and display filters, keep in mind that what we specify is taken in a literal sense. For example, filtering for port 80 traffic is not the same as filtering for HTTP. Think of ports and protocols more like guidelines instead of rigid rules. Ports can be bound and used for different purposes other than what they were originally intended. For example, filtering for HTTP will look for key markers that the protocol uses, such as GET/POST requests, and show results from them. Filtering for port 80 will show anything sent or received over that port regardless of the transport protocol.
In the next section, we will work with some of the more advanced features of Wireshark.
Questions
True or False: Wireshark can run on both Windows and Linux.
Which Pane allows a user to see a summary of each packet grabbed during the capture?
Which pane provides you insight into the traffic you captured and displays it in both ASCII and Hex?
What switch is used with TShark to list possible interfaces to capture on?
What switch allows us to apply filters in TShark?
Is a capture filter applied before the capture starts or after? (answer before or after)
Introduction to Network Traffic Analysis
- Network Traffic Analysis
- Networking Primer - Layers 1-4
- Networking Primer - Layers 5-7
- The Analysis Process
- Analysis in Practice
- Tcpdump Fundamentals
- Fundamentals Lab
- Tcpdump Packet Filtering
- Interrogating Network Traffic With Capture and Display Filters
- ~ Analysis with Wireshark
- Familiarity With Wireshark